The Market Stats widget will display a variety of summary data and current statistical information for a market.
Available Reports
- Summary Totals - show summary statistics for a market
- Comparison Table - create a table that compares something in a market
- Links List - create a list of links with counts of matching properties in a market
Selecting the type of report that the widget displays is achieved by using a filter option.
Parameters
Widget ID (required)
id="MBBv3_MarketStats"
Filters
The Market Stats widget display is controlled using the following filter options:
(a) Type of Report
filter="reportType:{type}"
There are 3 possible values.
- totals - totals summary
- comparison - comparison table
- links - link list
(b) Report Options
Include the following in the filter string.
- Comparison Table filter options:
- +compare:{field_name}
Select one of: property_type | city | zip_code | sub_area
- +compare:{field_name}
- Link List filter options:
- +linksfor:{city | zip_code | sub_area | county etc }
(c) Market Filter
Add search criteria filter options to set the area for the report.
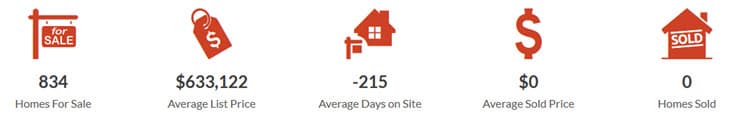
Summary Totals
Overview
This widget lets you show market summary stats totals for a market defined by a filter.
Colors will come from your widget theme.
Steps to Show Summary Totals
1. Choose Your Market Area
Decide what you want to show summary data for, for example:
- A city in your market
- A neighborhood in a city
- A zip code in your region
- Residential properties in a city
2. Add Widget to Page
Add the widget to your page where you want the summary to appear.
Example
Show summary totals for the city of Littleton:
<div id='MBBv3_MarketStats' filter='reportType:totals+mls_id:denver+city:littleton'>
[mbb_widget id='MBBv3_MarketStats' filter='reportType:totals+mls_id:denver+city:littleton']
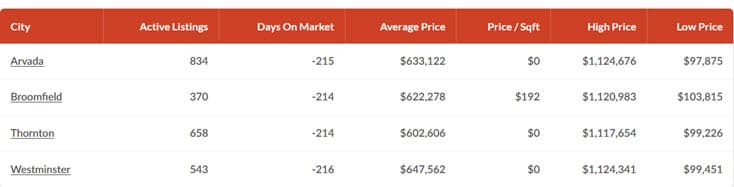
Comparison Table
Overview
This widget lets you create customized comparison tables that work great on both desktop and mobile devices. You can choose what to compare (like cities, neighborhoods, or property types) and which data to show (like prices, bedroom counts, or days on market).
Colors will come from your widget theme.
Steps to Create Your Table
1. Choose Your Comparison Focus
Decide what you want to compare, for example:
- Cities in your market
- Neighborhoods in a city
- Property types in an area
- Zip codes in your region
2. Set the Market Area
Add additional criteria to define the market area for the comparison.
For example, if you only want cities to be compared in a county or certain zip codes.
3. Add Widget to Page
Add the widget to your page where you want the table to appear:
Examples
<div id='MBBv3_MarketStats' filter='reportType:comparison+compare:city+mls_id:denver+zip_code:80126,80122'>
[mbb_widget id='MBBv3_MarketStats' filter='reportType:comparison+compare:city+mls_id:denver+zip_code:80126,80122']
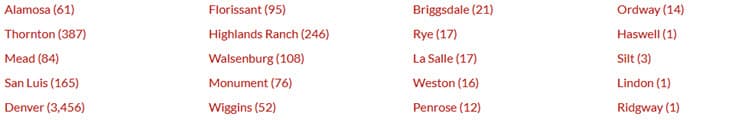
Links List
Overview
This widget creates list of links for values in a market.
Colors will come from your widget theme.
The list will be created in columns, with a maximum of 5 columns.
Steps to Create Your List
1. Choose Your Links
Decide what you want to show links for, for example
- Cities
- Zip_codes
2. Add Widget to Page
Add the widget to your page where you want the summary to appear:
Examples
<div id='MBBv3_MarketStats' filter='reportType:links+linksfor:city+mls_id:denver+zip_code:80126,80122'>
[mbb_widget id='MBBv3_MarketStats' filter='reportType:links+linksfor:city+mls_id:denver+zip_code:80126,80122']