
Deal stages and forecasts turn your conversations into a clear picture of the business you have coming. Every Buyer and Seller lead can have a deal stage, an expected commission and a close date, and the Sales Forecast report adds them up so you can see what is likely to close, and when.
Why it matters: A forecast tells you whether next quarter is on track while there is still time to do something about it. It shows which deals need a push, which leads need more prospecting, and gives team leaders a realistic view of revenue without chasing every agent for an update.
How Forecasting Works
A forecast is built from three things you record on each deal:
| Field | What to enter |
|---|---|
| Deal stage | Where the transaction stands in the Buyer or Seller Pipeline, for example Searching or Listed |
| Revenue ($) | The commission you expect to earn when the deal closes |
| Close Date | When you expect the deal to close |
Each stage has a fixed win probability. The further a deal has progressed, the more likely it is to close, so the more of its value counts toward your forecast.
Deal Stages and Win Probabilities
The stages and their probabilities are the same for every Buying Buddy account, so reports and team views always compare like with like. For a full description of each stage, see How to Categorize Your Leads.
| Buyer Pipeline | Probability | Seller Pipeline | Probability |
|---|---|---|---|
| Qualifying / Nurture | 10% | Qualifying / Nurture | 10% |
| Searching | 25% | Preparing | 20% |
| Negotiating | 60% | Listed | 35% |
| Under Contract | 90% | Negotiating | 65% |
| Closed | Won | Under Contract | 90% |
| Lost | - | Closed | Won |
| Dormant | - | Lost | - |
| Paused | - |
Only open deals count toward your pipeline. Closed deals count as won business, and Lost, Dormant and Paused deals are left out of the pipeline totals.
Set a Deal Stage and Forecast
1
From the Lead Dashboard
The quickest way while you are working a lead
- Open the lead from .
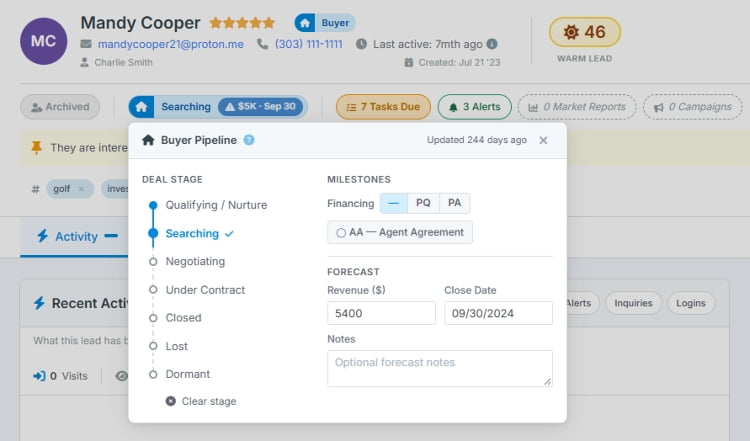
- In the status bar, click the Buyer or Seller pipeline (or Buyer deal stage? / Seller deal stage? if no stage is set yet).
- Click a stage. It saves right away.
- Enter Revenue ($), Close Date and any Notes, then click Save Forecast.
The forecast then shows next to the stage, for example Under Contract · $12K · Mar 15. If the close date passes while the deal is still open, it is flagged so you know to update it.
2
From Lead Summary
Update several deals without leaving the list
On , click the classification block under a lead's name. The Classify & Forecast window opens with both pipelines, so you can set the stage and forecast in one place. This works well during a weekly pipeline review, for example with the Active Pipeline Work Lists.
The Sales Forecast Report
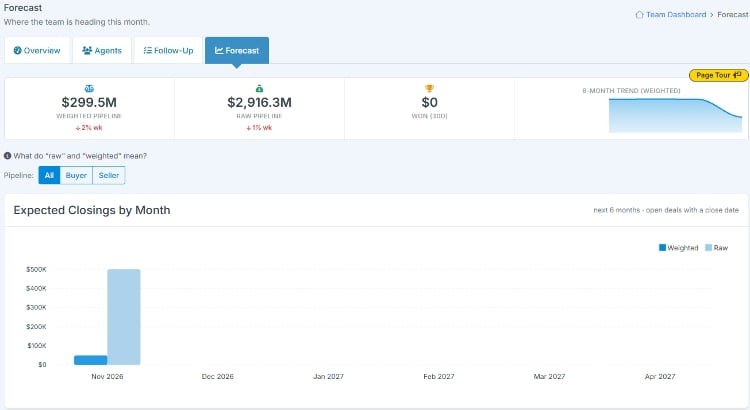
Go to and click Sales Forecast under Performance and Team.

Summary Numbers
Your pipeline at a glance
| Weighted Pipeline | The Revenue on every open deal multiplied by its stage probability. This is your realistic forecast. |
| Raw Pipeline | The full Revenue on every open deal, with no probability applied. This is the best case if everything closes. |
| Won (30d) | The value of deals marked Closed with a close date in the last 30 days |
| 6-Month Trend | How your weighted pipeline has changed over time. The trend builds from nightly snapshots, so it fills in over the first week or so. |
Weighted and Raw Pipeline also show how much they have changed over the last week.
Expected Closings by Month
When the revenue should land
A chart of weighted and raw value by close date over the next six months. Hover over a month to see the totals and number of deals. Use the Pipeline buttons (All, Buyer, Seller) at the top of the report to focus on one side of your business.
Pipeline by Stage
Where your deals are sitting
One bar for each stage of the Buyer and Seller Pipelines, showing the number of leads, the stage probability, and the weighted and raw value. Arrows show how many deals moved into or out of a stage over the last week. Click a stage to see the deals behind it.
Open Deals with No Close Date
Business the forecast cannot time yet
If any open deals are missing a close date, a notice shows how many there are and their total value. Click it, then View these leads to open them on Lead Summary and add the dates.
Forecast by Agent
For teams
A table of leads, raw value and weighted value for each person. Use View by to switch between:
- Assigned Agent: each deal is counted once, under its assigned agent, so the totals add up to the team pipeline.
- All Roles: each deal is counted for every person involved, such as the agent, lender and assistant. This shows how much business each person is part of, so totals can be more than the team pipeline.
Click a name to see that person's leads.
Whose deals are included? Account Admins, and users with permission to manage account leads, see the whole account. Other agents see only their own deals. Leads with the Contact Type Archived or Bogus are always left out.
Put It to Work
Example: Raw vs Weighted
Why the realistic number is lower
You have two buyers. One is Under Contract with $12,000 expected commission, the other is Searching with $10,000.
- Raw Pipeline: $12,000 + $10,000 = $22,000
- Weighted Pipeline: ($12,000 x 90%) + ($10,000 x 25%) = $10,800 + $2,500 = $13,300
Plan your business around the weighted number. As the searching buyer moves to Negotiating, their weighted value rises from $2,500 to $6,000.
Example: A 15-Minute Weekly Pipeline Review
Keep the forecast honest
- Open the Sales Forecast report and fix any open deals with no close date.
- On Lead Summary, open the Closing This Month Key List and confirm each deal is still on track.
- Work through the Active Pipeline Work Lists, starting with Negotiating and Under Contract. Move each deal to its current stage, and mark deals that have gone cold as Dormant or Paused so they stop inflating your pipeline.
- Check the weekly change on Weighted Pipeline. If it is falling, focus the coming week on moving Qualifying and Searching leads forward.
Frequently Asked Questions
Can I change the deal stages or their probabilities?
No. Deal stages and their probabilities are set for all accounts and replace the editable Sales Steps that were previously found in Account Settings. Fixed stages mean your forecast, Work Lists and team reports always line up. Use tags for any extra detail you want to track.
Why is a deal missing from Expected Closings?
The chart only includes open deals with a close date in the next six months. Check that the deal has a close date, that the date is not in the past, and that it is in an open stage rather than Closed, Lost, Dormant or Paused.
A lead is both buying and selling. Is that two deals?
Yes. The Buyer and Seller Pipelines each have their own stage and forecast, so a move-up client can show as a Listed seller and a Searching buyer at the same time, each with its own expected commission and close date.
What should I do when a deal closes?
Set the stage to Closed and update the close date and Revenue to the final figures. The deal then counts toward Won (30d), and the lead appears in the Closed Buyers or Closed Sellers Work List, ready for your past-client follow-up. You may also want to change their Contact Type to Past Client.