Every modern web browser includes a function called "developer tools".
These tools help us find out more about the underlying page code and functions.
In the case of Buying Buddy it provides a very useful way for debugging JavaScript that isn't working as expected.
This article provides instructions on how to access and view the messages in this tool.
Follow the instructions below to discover potential problems.
If you need assistance from us, then send us a screenshot of these error messages in your help ticket, so that we can more quickly resolve issues.
Open Developer Tools for Your Browser
There are 2 ways to do this
- Keyboard:
- Windows: F12
or Ctrl + Shift + I - macOS: ⌘ + ⌥ + I
- Windows: F12
- Menu bar:
- Firefox: Menu
 > More Tools > Web Developer Tools
 - Chrome: More tools > Developer tools
- Safari: Develop > Show Web Inspector.
If you can't see the Develop menu, go to Safari > Preferences > Advanced, and check the option for "Show Developer menu" in menu bar. - Opera: Developer > Developer tools
- Firefox: Menu
Go to the Console
Open developer tools - then click or press the "Console" tab.
Here's how it looks in Firefox. It's very similar in all other browsers.
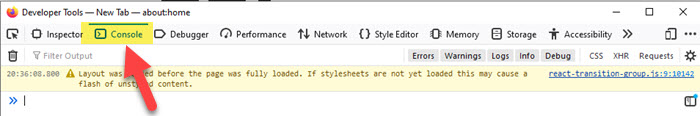
In the example above there are no 'errors'. These would be shown in RED
Errors displayed in the Console
Here are some examples of the errors you might see in the Console
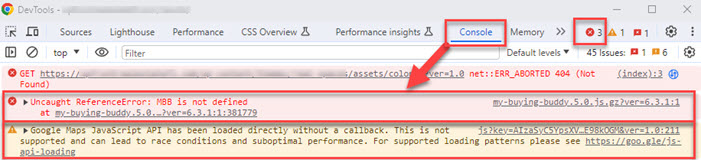
The ones to look out for will mention "MBB", "Buying Buddy".
This example is from the Chrome console and shows error messages.
In this case, there is an error message "MBB is not defined".