
Property Engagement turns the listings a lead has viewed on your website into a quick picture of what they are really shopping for: their price range, the areas they keep coming back to, the kind of home they look at, and whether their interest is heating up or cooling off.
Why it matters: What buyers tell you and what they actually look at are often different. Property Engagement shows you their real behavior, so you can talk about the right homes, at the right price, in the right neighborhoods, from the very first sentence of your call.
Where to Find It
Go to and click a lead's name to open their Lead Dashboard. The Property Engagement panel is in the right-hand sidebar, just below Suggested Actions.
The panel covers the last 90 days of property views. Click How to read this panel at the top for a short built-in guide, or the ? icon next to the title.
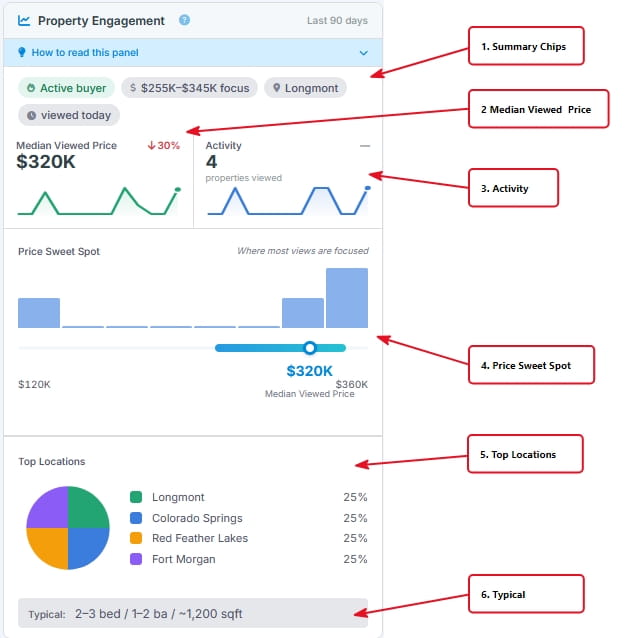
Reading the Panel
1
Summary Chips
The whole story in one line, ready for your call
The row of small chips at the top summarizes the lead's browsing. A chip only appears when there is enough data for it.
| Chip | Example | What it means |
|---|---|---|
| Activity level | Active buyer | See the activity levels table below |
| Price focus | $450K-$600K focus | The price band where most of their views fall |
| Top locations | Aurora · Castle Rock | The city they view most. A second city is shown when both account for more than a quarter of their views |
| Last viewed | viewed 2 days ago | When they last looked at a property |
| Saved | 3 saved | How many properties they saved as favorites in the period |
| Activity level | When it appears | What to do |
|---|---|---|
| 🔥 Active buyer | Viewed a property in the last 7 days, or 5 or more property views in the last 30 days | They are shopping now. Call while the homes are fresh in their mind |
| 👀 Casual browser | Some views in the last 30 days, but not enough to count as active | Keep them engaged with a well-targeted listing alert |
| ❄️ Cooling off | Views earlier in the 90 days, but none in the last 30 days | Reach out before they go quiet for good, or check that their alert still matches what they want |
2
Median Viewed Price and Activity
Two trend cards: what they are looking at, and how much
Median Viewed Price is the middle price of all the properties they viewed, so a few outliers do not skew it. The small line chart shows the median week by week. The arrow compares their more recent views with their earlier views:
- Arrow up - they are looking at higher-priced homes than before. They may have been pre-approved for more, or are stretching for the right home.
- Arrow down - they are looking at lower-priced homes. Budget may be a concern, which is a good conversation to have.
- Dash - their price range is steady.
Activity is the number of different properties they viewed in the last 90 days. The line underneath can also show their total number of views (when they looked at some homes more than once) and how many they saved. The arrow compares this period with the 90 days before it, so you can see at a glance whether their search is ramping up or slowing down.
3
Price Sweet Spot
Where most of their views are focused
The bar chart spreads every viewed price from the lowest (left) to the highest (right). Taller bars mean more views at that price.
- Shaded band - the middle half of their views. This is their real comfort zone.
- Dot and price label - the Median Viewed Price.
- Prices at each end - the lowest and highest priced homes they viewed.
A narrow band means the lead knows exactly what they can spend. A wide spread means they are still exploring, and may welcome help narrowing down their budget.
Note: If the lead has viewed only one property, or every property they viewed has the same price, the chart is replaced by a short message because there is no range to show.
4
Top Locations and Typical Home
Where they want to live, and what they want to live in
Top Locations is a pie chart of the cities where they viewed properties, counting each property once. The top four cities are shown by name, and any others are grouped as Others.
Typical describes the home they view most often, for example Typical: 3 bed / 2 ba / ~1,800 sqft. Bedrooms and bathrooms show the most common value, or a range such as 2-4 bed when there is no clear favorite. Square footage is the middle value, rounded.
Put It to Work

Example: Open the Call with What Matters to Them
From "just checking in" to a conversation they want to have
Mark's chips read Active buyer · $450K-$600K focus · Aurora · Castle Rock · viewed today · 3 saved, and his Median Viewed Price arrow is up 8%. Instead of "Are you still looking?", you can open with:
"I noticed you've been looking at some great 3-bedroom homes in Aurora and Castle Rock, and a few of them are a little higher than you started out. Would it help to see what's just come on the market in that range?"
Then check the Listings tab to see exactly which homes he saved and viewed most.
Example: Build a Listing Alert That Gets Opened
Match the alert to their real behavior
When you create or edit a listing alert, use Property Engagement as your guide:
- Set the price range to roughly match the Price Sweet Spot shaded band.
- Choose the cities shown in Top Locations.
- Use the Typical line for minimum bedrooms and bathrooms.
Alerts that match what a lead is already browsing are more likely to be opened, which brings them back to your website and keeps you top of mind. See How to Set Up New-Listing Alerts.
Example: Spot a Seller Researching the Market
Browsing their own neighborhood is a signal too
If a homeowner keeps viewing homes in their own city and price range, they may be sizing up what their home is worth. Add Seller to their Interest Type, then offer a market report or a home valuation conversation.
Frequently Asked Questions
Why is the panel empty or showing very little?
Property Engagement is built from properties the lead viewed on your website while signed in, in the last 90 days. New leads, or leads who have not visited recently, will have little or nothing to show yet. A well-matched listing alert is the best way to bring them back.
Can I change the time period?
No. The panel always looks at the last 90 days, which is long enough to show a pattern and recent enough to reflect what the lead wants today. To see every property they have ever saved, use the Listings tab.
How is this different from the Activity Score?
The Activity Score in the lead header measures how engaged the lead is overall, including visits, searches, saves and email activity. Property Engagement focuses only on the properties they viewed, to tell you what they are interested in. Use the score to decide who to call, and Property Engagement to decide what to talk about.